The Energy Transition Hub is pleased to launch the OpenNEM project that makes public National Electricity Market (NEM) data accessible. We hope that improved access will facilitate public understanding of the market, improve energy literacy and facilitate a more informed national discussion on Australia’s energy transition in the long-term interests of consumers.
As others have recently pointed out, NEM data is not readily accessible to many, leaving the workings of the market opaque. By providing a clear window on the data, we hope to address the information asymmetry between stakeholders and to improve the productivity of those engaged in energy market discussions. In particular, we are keen to empower organisations advocating for reform or researching issues in the NEM that have significant implications for consumers. Internationally, the importance of open and transparent energy data is also gaining prominence. Open practice facilitates better research and promotes evidence-based policy. OpenNEM is a significant step in this direction for the Australian energy markets.
Statewide generation and price data
In this first release, OpenNEM includes visualisations for the five NEM regions — South Australia, Victoria, Tasmania, New South Wales (including the ACT) and Queensland, and the NEM as a whole. OpenNEM provides visibility for the past seven days of generation by region and by technology (and for the past three days in the widget).
The OpenNEM website shows a page for each region including the energy, proportion of contribution and volume weighted price for each technology. The volume weighted price reflects the spot market value for each source of generation, i.e. the revenue that would be received by a ‘merchant project’ — a facility that always takes spot prices, without any hedging or contracting arrangements.
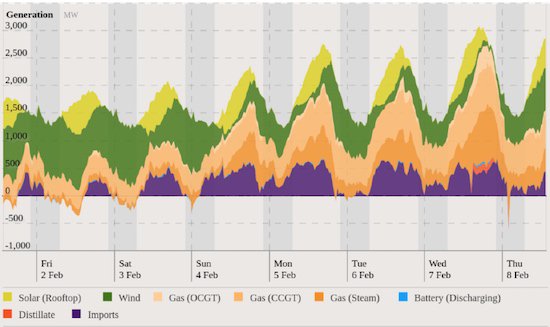
Below are some examples from the past week. One of the striking aspects is that each region in the NEM has a different ‘personality’ based on its natural resources and legacy investment decisions. First, and perhaps most interesting is South Australia. With no remaining coal fired power station, we see a network without so-called “baseload-generation”. South Australia’s production swings between high wind generation and export, to high gas generation and import over the course of a week, with rooftop solar reliably reducing peak demand and pushing it into the evening.
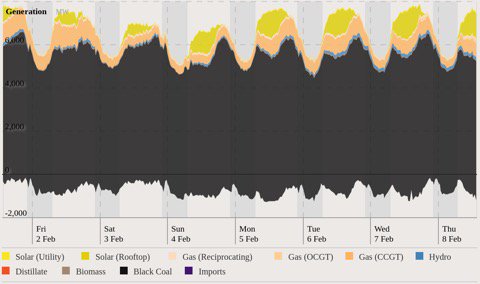
At the other end of the spectrum (and the NEM) is Queensland, substantially powered by black coal. Despite the heavy reliance on fossil fuels, the impact of rooftop solar in the Sunshine state is clearly visible. As has previously been reported, the aggregated capacity of rooftop solar is Queensland’s largest power station.
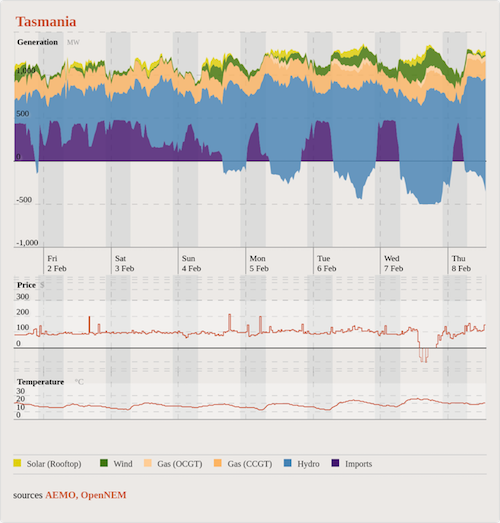
Each other state similarly has its own particular traits. Victoria, at the centre of the NEM, is currently dominated by inflexible brown coal, with increasing shares of both wind and solar, and draws on hydro (internally, and from SA and Tasmania) in times of peak demand. NSW is dominated by relatively flexible black coal. Compared with Victoria, the black coal appears to take on a much larger share of the intermediate load than either hydro or gas. Tasmania is particularly interesting. Basslink is clearly getting a regular workout, with the state often switching between import and export on an almost daily basis, raising questions about Tasmania’s desire for a so called NEMexit!
We invite you check out the other states on the website and see their personalities as the seasons change and the energy transition continues.
Users of the Chrome browser can enjoy the additional functionality of exporting charts such as these, as a PNG suitable for posting to social media. An example illustrating the import export swings on Tasmania is shown below.
Future development and feedback
Future releases will allow data export. This will enable researchers, journalists and the curious to undertake their own analysis. We will also be extending both the data coverage and functionality. This will include historical data, and the ability to drill down to the individual generator level. In time, we hope to extend OpenNEM to include visibility of the Western Australian market, which operates separately and publishes different data sources.
We are very excited by the reception we’ve received during the testing phase and are keen to hear suggestions and of any areas where OpenNEM is confusing or has rough edges. OpenNEM has been developed by Dylan McConnell, Steven Tan and Simon Holmes à Court and was part funded by a grant from Energy Consumers Australia.


